Performances
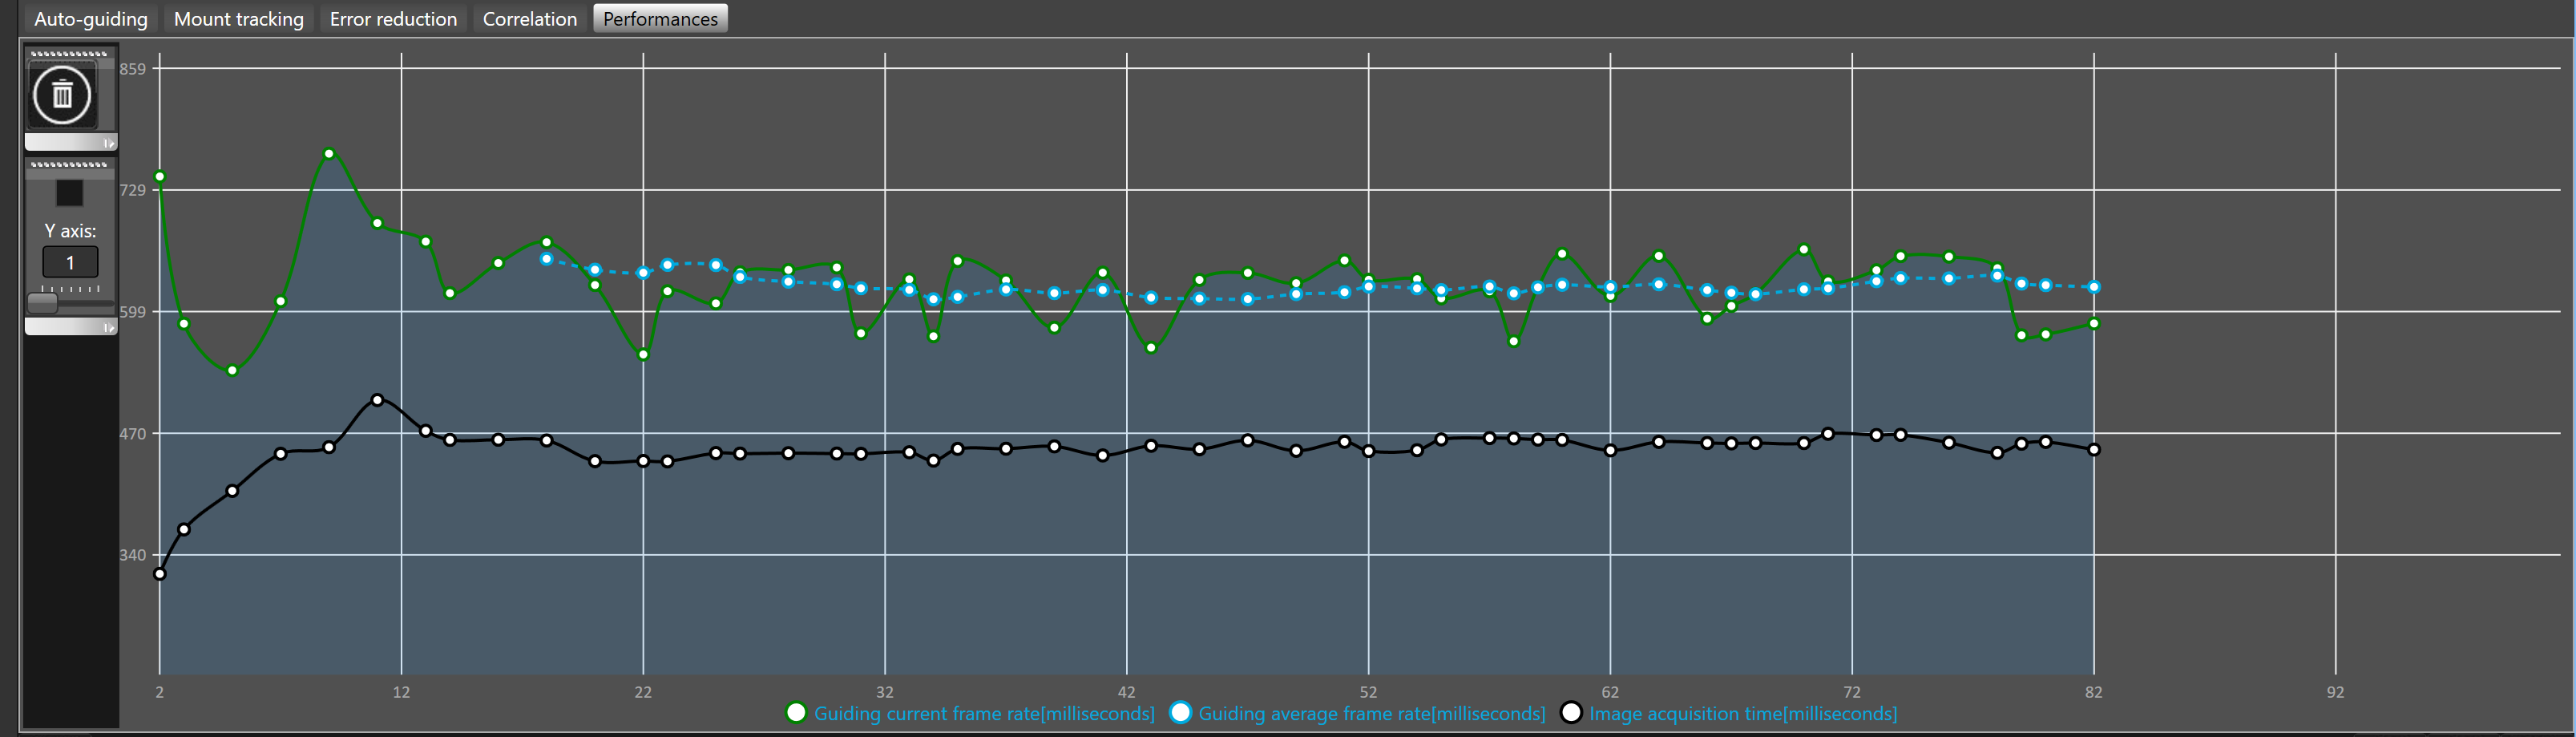
This plot shows the history of the guiding frame rate in milliseconds.
By default, the number of iterations displayed in the graph is 50.
To change the plot history length, see advanced settings.
The black curve correspond to the frame rate of the acquisition loop only (exposing,downloading, and pre-processing).
The green curve correspond to the frame rate of all related computations (exposing, downloading, pre-processing, and auto-guiding close loop calculations).
The blue-curve is the average guiding frame rate.
 It is normal and expected that the frame rate leads to longer times than the guider exposure time set.
The difference is coming from the frame download (USB) and SkyGuide frame pre-processing.
Since Windows is a multi-task OS those values may fluctuate from time to time, depending of what the OS is doing.
However excessive long values, relative to the normal operation, may be related to some USB link problems and failures, which may eventually leads to SkysGuide time out and a guider re-connection tentative by SKG (see the event log file for more information).
SkyGuide will try as much as possible, after an unexpected USB failure, to reconnect the guider however in some cases it may not be possible to fix the problem without rebooting the application.
If such problem arise we recommend to inspect your USB links, HUB and settings of the camera drivers. For instance you may want to consider a lower USB traffic value (<100%) for the camera driver setting since they may have to share the same USB cable.
When two large frames may be downloaded in the same time the US bandwidth (especially with an USB hub) may not be large enough, therefore setting the traffic bandwidth of both cameras to, or below, 50% should be consider in the eventually a two frame traffic collision .
Plots are cleared when guiding is started. You can manually clear the plots with the  button.
 To record the history into a file that can be later on used for analysis, SKG allows to write all Information into a Comma Separated File. Output to CSV can be enabled/disabled while guiding at any time.
By default the scale of the Y axis is automatically adjusted to fit the values displayed in the plots but sometimes to ease the reading it could be good to use a fixed scale.
The vertical toolbar allows to define how the Y axis will be displayed:
The check box allows to fix use the value displayed under Y axis label as a fixed scale.
To change the Y axis scale you must use the slider bellow the Y axis label.