Plots (standard GUI)
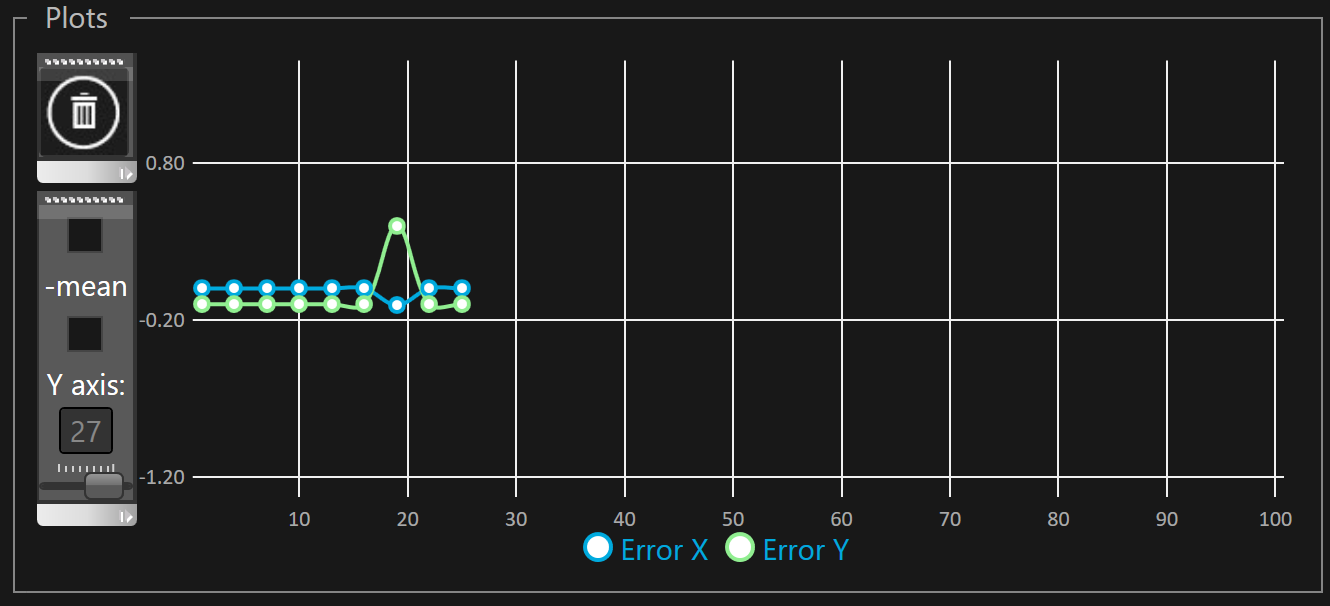
In the standard GUI plots show the history of the auto-guiding error for both axis X and Y.
By default, the number of auto-guiding errors displayed in the graph is 50.
To change the plot history length, see advanced settings.
To change the unit of errors, see guiding settings.
 Plots are cleared when guiding is started. You can manually clear the plots with the
 ![]() button.
button.
 When plots are cleared RMS values displayed in the current image are also cleared.
To record the history into a file that can be later on used for analysis, SKG allows to write all Information into a Comma Separated File. Output to CSV can be enabled/disabled while guiding at any time.
By default the scale of the Y axis is automatically adjusted to fit the error values displayed in the plots but sometimes to ease the reading it could be good to use a fixed scale.
The vertical toolbar allows to define how the Y axis will be displayed:
The upper check box allows to fix use the value displayed under Y axis label as a fixed scale.
To change the Y axis scale you must use the slider bellow the Y axis label.
The check box under the -mean label allows to subtract the error mean to the tracking error.
The goal behind the mean subtraction is to remove any constant error caused by tracking drifts providing a better understanding of short term tracking errors.