Information
The information panel shows the status of the guiding loop and all statistics about the tracking errors.
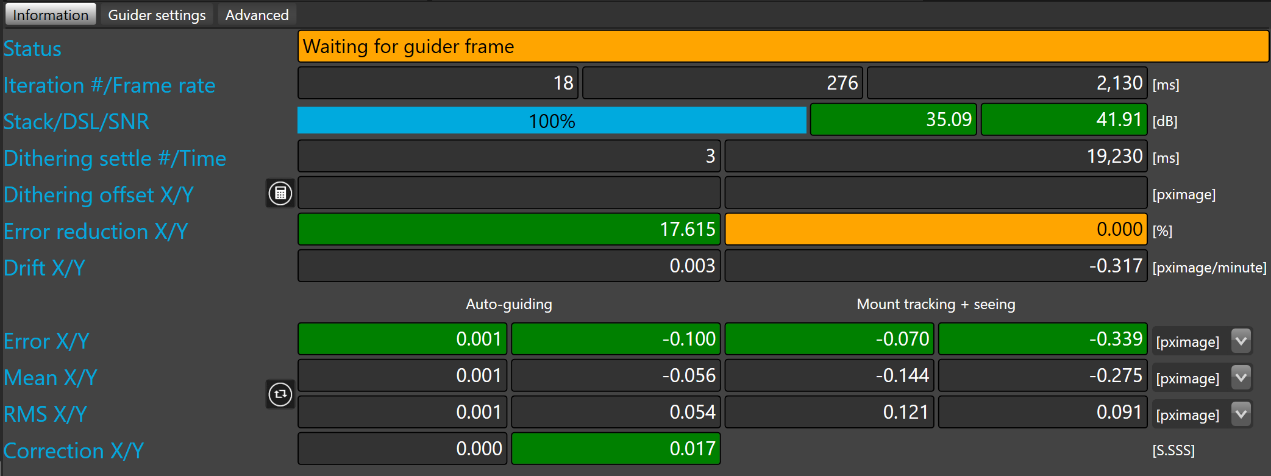
Status shows the current status of the guiding loop, the following status are available:
|
Status |
Description |
|
Idle |
Guiding loop is not running |
|
Calibrating |
Calibrating guider |
|
Analyzing |
Analyzing guider frame to measure tracking errors |
|
Moving |
Sending measured correction to the acquisition loop to move the telescope through the guider relay |
|
Waiting for guider frame |
Guiding loop is waiting on the acquisition loop to get the next guider frame |
|
NO CORRECTION! Waiting frame |
For various reason there are no corrections available, the guiding loop is waiting for the next guider frame.
|
|
Paused |
Guiding loop has been paused. |
|
FAILED! Waiting frame |
A failure occurred in the guiding loop (check SkyGuide.log to get more information about the failure). |
|
Guider settle |
Guider is settling according the settling time |
|
Stacking |
Guiding loop is stacking the guider frame to build the reference frame. |
|
POOR CORRELATION! Waiting frame |
Guiding loop has detected a correlation factor below the configured threshold.
|
|
Dithering |
Guiding loop is shifting the telescope to the committed dithering offset. |


Iteration #/Frame rate display the total number of frames processed by the guiding loop since it was started, the last frame rate and the average frame rate in milliseconds.
Stack/DSL/SNR display the progress of the number of frame stacked, the dynamic range and the signal to noise ratios of the stacked frame.
Dithering settle #/Time display the number of frame and the time in milliseconds that is required to settle the dithering move.
Dithering offset X/Y display the offset currently used by the dithering process in pixel image. The  button allows to randomly calculate a new offsets within the allocated range.
Error reduction X/Y display the percentage of tracking error (open loop) that is reduced by the guiding algorithm.
This calculation is based to the rms errors and therefore takes some time to settle.
It is computed as: ((tracking_error - guiding_error) / tracking_error)*100 [%]
Tracking_error = open loop error, see below.
Guiding_error = closed loop error, see below.
 The history of error reduction is available in the error reduction plot
 Negative error reduction values indicate that the auto-guiding makes the situation worse than leaving the mount alone (beside drift), or open loop. This may happen when "chasing" the seeing with short guider exposures and/or large aggressiveness values.
In such case increasing the guider exposure time and/or decreasing the aggressiveness values should help.
Since the calculation is based to the RMS errors one should wait long enough for the RMS values to settle after any change in the system parameters. Using the aggressiveness optimal guiding calculator provide recommended values of those for a given guider exposure time.
 Guiding correction can be suspended while the error reduction goes below a given threshold
Drift X/Y display the drift in pixel image or arc-second per minute on both axes. The drifts are caused by inaccurate polar alignment, atmospheric refraction, flexure, or mount cone error.
For providing an objective measurement of the efficiency of auto-guiding we made a clear distinction between closed loop and open loop errors.
The closed loop errors (left column) correspond to the residual errors that are measured after correction.
The open loop errors (right column) correspond to the mount tracking and seeing errors without any correction (like if SKG is not running).
Error X/Y display the error on both axes for both loops in the specified units.
Mean X/Y display the average error on both axes for both loops in the specified units.
RMS X/Y display the root mean square error on both axes for both loops in the specified units (used in the error reduction calculation).
Correction X/Y display the duration of the correction pulse in seconds.
The units allows to decide in which unit the errors will be displayed in the information panel and in the plots. There is two choice : pixel image and arc-second.
The  button allows to clear the mean and RMS values.