The telescope collimation is the process of aligning the telescope elements, typically optical surfaces, relative to each others at their designed values for a given optical layout. This is paramount since without accurate alignment the telescope performances can, and will, drop quite drastically. Collimation related to the 3D position of the elements, meaning tilt/tip, offset and spacing are all part of the collimation (alignment) process. There are 5 degrees of freedom per optical element.
Since collimation impacts the telescope optical performances there will be miss-alignment induced aberrations, those in turn can be used to infer the state of the scope alignment, providing feedback during the collimation process, in short collimation by the numbers.
A first level of collimation can be achieved by measuring mechanical alignment of the surfaces, this is usually done with a combination of optical tools (eyepieces, collimation telescope, …) and laser beams. Some telescope, such as Ritchey–Chrétien (RCT), provides reference marks (dark spots and donuts) to help in the process. However, although useful, this first collimation step is usually not enough, it should be consider as a coarse adjustment, to be followed by a optical fine alignment looking at the telescope aberrations. One should remember that to reach full telescope performances (Strehl’s ratio at or above 80%) aberrations should be kept within a fraction of wave. In the visible band, with an average wavelength of 550nm, this means aiming for wavefront errors in the range of 75nm rms.
Wavefront analysis provides an accurate and quantitative way to measure the telescope aberrations, hence departure for its perfect collimation, by looking at the errors (in term of phase) between a perfect optical system and the actual telescope.
From such analysis one retrieves not only aberrations, including their types and amounts, but also the scope Strehl’s ratio (SR) and OTF (Optical Transfer Function) which including the MTF (Modulation Transfer Function), those are quantitative indicators of the telescope performance and therefore the quality of the images taken with it. Wavefront analysis usually requires a dedicated hardware, known as a wavefront sensor, the most common one being the Shack-Hartmann wavefront sensor.
Innovations Foresight has designed a patent pending technology using a de-focused image of a star (natural or artificial) for retrieving the scope wavefront using AI, hence the scope aberrations therefore a dedicated wavefront sensor is not needed anymore.
This technology works with a single frame even under seeing limited conditions. The most common approach uses an on axis star, but this is not a limitation, a star field can be used to get, at once, field dependent aberrations which may be necessary for a perfect collimation of some type of telescopes, such as a RCT. Although this technology is used for telescope collimation it can be easily adapted and tailored for many other applications, feel free to contact us for any custom needs and applications.
Wavefront analysis
Wavefront analysis provides a precise quantitative evaluation of the all optical system and its related aberrations.
In the context of an imaging system, such as a telescope, the optical elements are designed to produce an image as sharp as possible of an object at the focal plane where a camera (CCD, CMOS sensors) or science equipment is located. When the source is a point (object) its image is known as the Point Spread Function, or PSF.
Simple geometric optics (ray tracing) gives us a first, but simplify idea, of the image of an object for a given optical layout.
What is missing is the diffraction effect related to the finite size of the imaging system, the scope aperture (basically its diameter). This is the result of the wave nature of the light. Unlike with geometric optics a point source is imaged as a spot, the PSF. The extend of the blur being a function of the scope aperture and focal length. One uses Fourier optics to take in account the (scalar) diffraction effect of the light.
Without losing any generality let’s assume that we are imaging a star from space (no seeing, yet) with our telescope. Since any star is so faraway, relative to our scope focal length, one can easily consider it as a mathematical perfect point source. The light, an electromagnetic (EM) wave, emitted by the star can be seen as a spherical wave (3D) centered at the star location, this wave propagates at the light speed in the vacuum of space. This is similar to the circular wave (2D) in the surface of the water created by the impact of a small object (say a stone).
When the star light reaches our telescope location one only accesses a very tiny portion of the spherical wave, at our scale it looks like a perfect plane wave (the star being so faraway). The telescope images the star as a PSF, in this context the plane wave is transformed by the telescope optics to a new spherical wave converging at the focal plane where the geometry optics predicts the location of the star image, a point. In our case because the scope diameter (D) is limited this result to a blurred point, or the PSF. Wavefront analysis studies the departures from the ideal spherical wave that any imaging system, like a telescope, should create. Aberrations are deviations (errors) from this expected spherical wave due to limitations, imperfections, tolerances, and miss-alignment of the optics. Meaning the actual wave converging to the focal plane is not a prefect spherical one anymore.
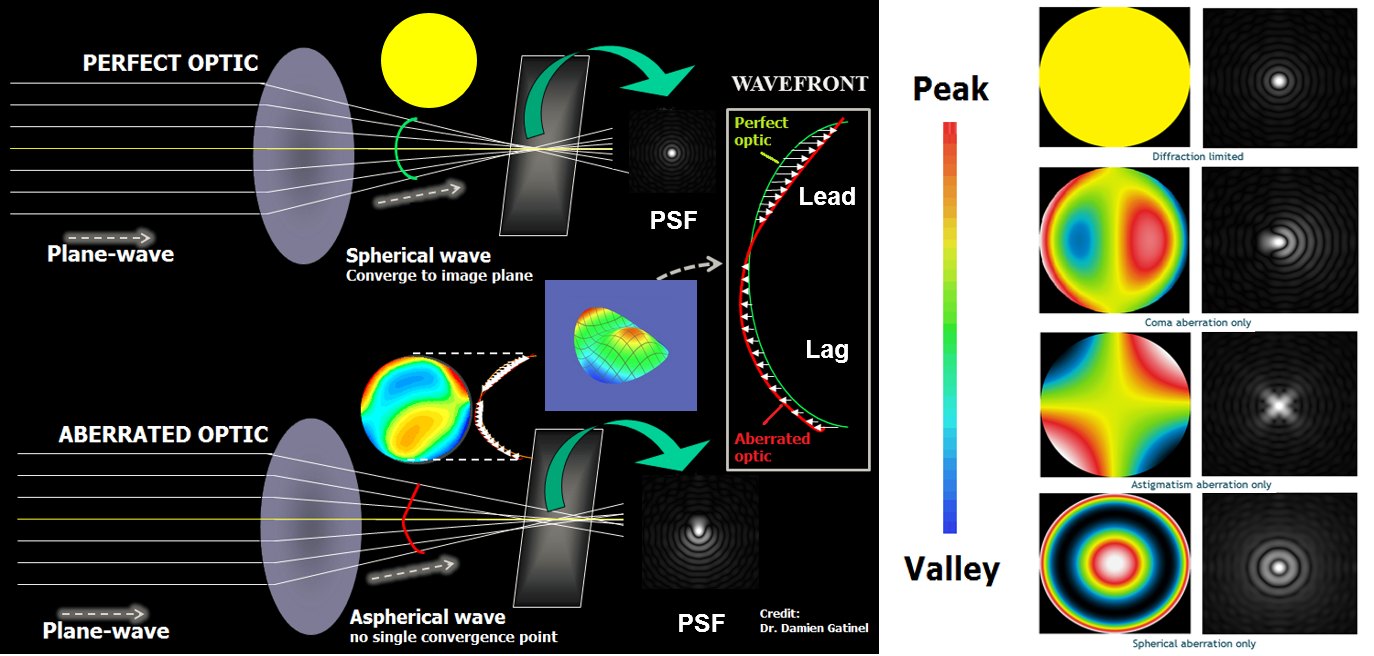
The figure above, on the left side, shows two similar imaging systems (say telescopes). The top one is perfect (diffraction limited, DL), the resulting spherical wave converges to the focal plane where the PSF is located. The rays, which are by definition perpendicular to the wave front, intercept the focal plane at one point (ray tracing from geometric optics), they all are parallel to the spherical wave radii in direction of the sphere center (the image point).
The yellow disk (“heat” map) displays the color coded wavefront error (know has the phase error), departure from a perfect spherical wave. In the DL case there is no error, hence a uniform yellow disk. The color bar on the right indicates, from a qualitative view point here, the wavefront errors. Reddish colors mean peaks in the wave front error surface, meaning the the actual wavefront leads the expected (perfect) wavefront one, while blueish colors mean valleys (troughs) in the wave front error, the actual wave front lags behind the perfect one. One usually expresses those wave front errors in term of manometers (nm) or in term of wave for a given reference wavelength.
Since the EM radiation (light in our case) amplitude is a periodic sinusoidal function a departure of one wave means a phase shift of 360 degrees (2 Pi). Hence the name phase error. No phase error means that the PSF is perfect and the system is diffraction limited. The system shown below the DL one exhibits some distortions in the wave front, leading to wave front errors expressed by the various color shades in the wave front heat map. One can clearly see one peak and one trough on its 3D version next to it. This is the fingerprint of coma, which makes the PSF looking like a comet shape.
On the right part of the figure there is examples of basic aberrations with their names, wave front errors (heat maps) and related PSFs.
AI based wave front sensing (AIWFS)
Roddier & Roddier [1] proposed in 1993, in the context of adaptive optics (AO), the use of two images of a single defocused star to extract wavefront information from their intensity, or irradiance, profiles. This technique is known as curvature sensing, or CS in short.
CS relies on taking two near instantaneous images (few ms apart) of the same star from two different locations in the optical path, near the focal plane, in order to cancel out seeing scintillation for AO. This approach implies the use of an optical beam splitter and related optical system as well as two dedicated cameras/sensors. It has been shown that a single defocused image of a star is enough for retrieving WF phase information [2].
The figure below shows, in the context of a refractor, the concept, finding the WF error from the irradiance (image intensity) of a defocused star.
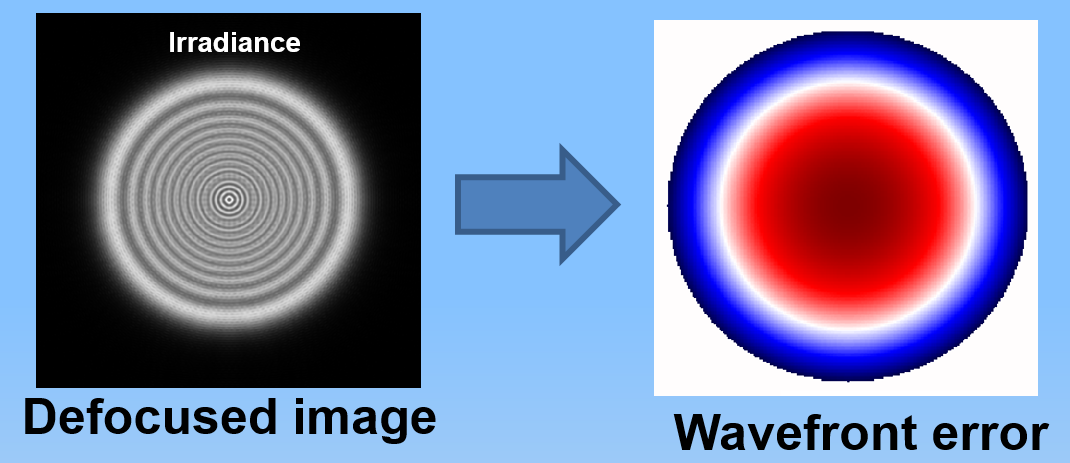
It exists, under the proper conditions, a mathematical relationship between the irradiance (intensity profile) and the WF described by a non-linear differential equation known as the irradiance transfer equation, or transport of intensity equation (TIE). The TIE links the irradiance I to the WF W however this equation cannot be solved analytically, instead one uses numerical methods.
Therefore the WF phase error is estimated, for each new image taken, by solving the TIE AT RUN TIME with numerical optimization algorithms.
In order to minimize computing time as well as power one usually relies on some approximations (typically linearity) which may be valid only under some defocus conditions and limited amount of aberrations. This method for solving the TIE at run time is know as the direct model approach.
By leveraging Innovations Foresight extensive knowledge and long experience in machine learning (ML) and AI we designed a novel approach [3] which learns the inverse model, the relationship between the defocused star image intensity and the WF, often expresses in a parametric way using the Zernike polynomials. This is not a limitation other representations of the WF and related aberrations can be learned too.
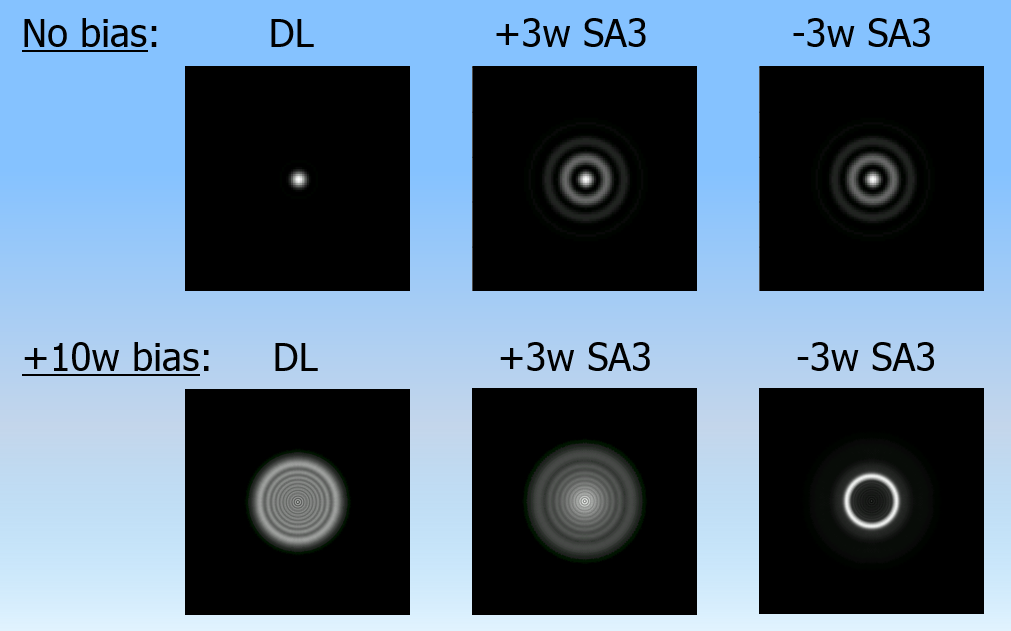
When using a defocused star one essentially adds a bias, known as phase diversity (PD), to the WF which in turn allows for retrieving the phase error without any ambiguity as long as the measured aberration magnitudes are less than the diversity term. The figure below expresses this concept, the first line most left image shows a DL PSF, a perfect Airy disk of a star (no seeing), the next two images on the same line are, from left to right, the resulting PSF with +3 waves of spherical third-order (SA3) and -3 waves SA3 aberrations respectively. Both images are identical, meaning WF sign error is lost, there is ambiguity. The line below shows the same situation when adding a +10 waves of defocus bias (PD), one can now clearly separate a +3 versus a -3 waves of SA3, or other type of aberrations for that matter, the WF error ambiguity as been resolved.
As stated before because we do not have an analytic solution for the TIE differential equation we use a numerical approach. The main and key difference between the direct model discussed above and the inverse model is that the latter is computed beforehand once for all, therefore the run time calculations are straightforward and very fast, we can process at video rates if needed for applications such as AO. OF telescope collimation on the other hand we use longer exposures in the order of 30 to 60 seconds in order to average out the seeing since we are only interested, unlike for AO, in the telescope aberrations, not the ones induced by the seeing.
Since we are not restricted by any real time constraint for solving the TIE we can spend a lot more time learning the inverse model, days, weeks, or more if needed.
This also means that we do not have to make any approximation, assumption, or limit the technique to any subset of aberrations and defocused ranges, making this method much more generic, flexible and useful than solving at run time for the WF using the TIE. Multi and extended sources can be considered as well.
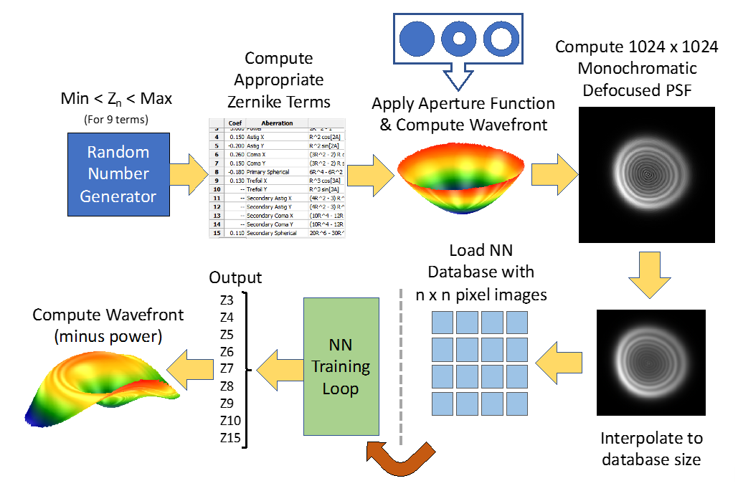
The process involved a feed forward artificial neural network (NN) which is trained exclusively on synthetic (simulated) data for a given class of optical systems (telescopes in our application for astronomy). Those training databases are simulated defocused images, including seeing effects, of a star with a known level and type of aberrations. The ANN is then trained during the learning process to output from those images the related WFs, typically in the form of the the Zernike polynomial coefficients used to express the aberrations, or any other relevant alternate ways. The figure below expresses the all process.
SkyWave (SKW)
The Innovations Foresight technology provides a powerful quantitative optical way to analysis and collimate a scope by the numbers using one or more defocused star in the field and our patent pending AI based Wave Front Sensing (AIWFS) technology.
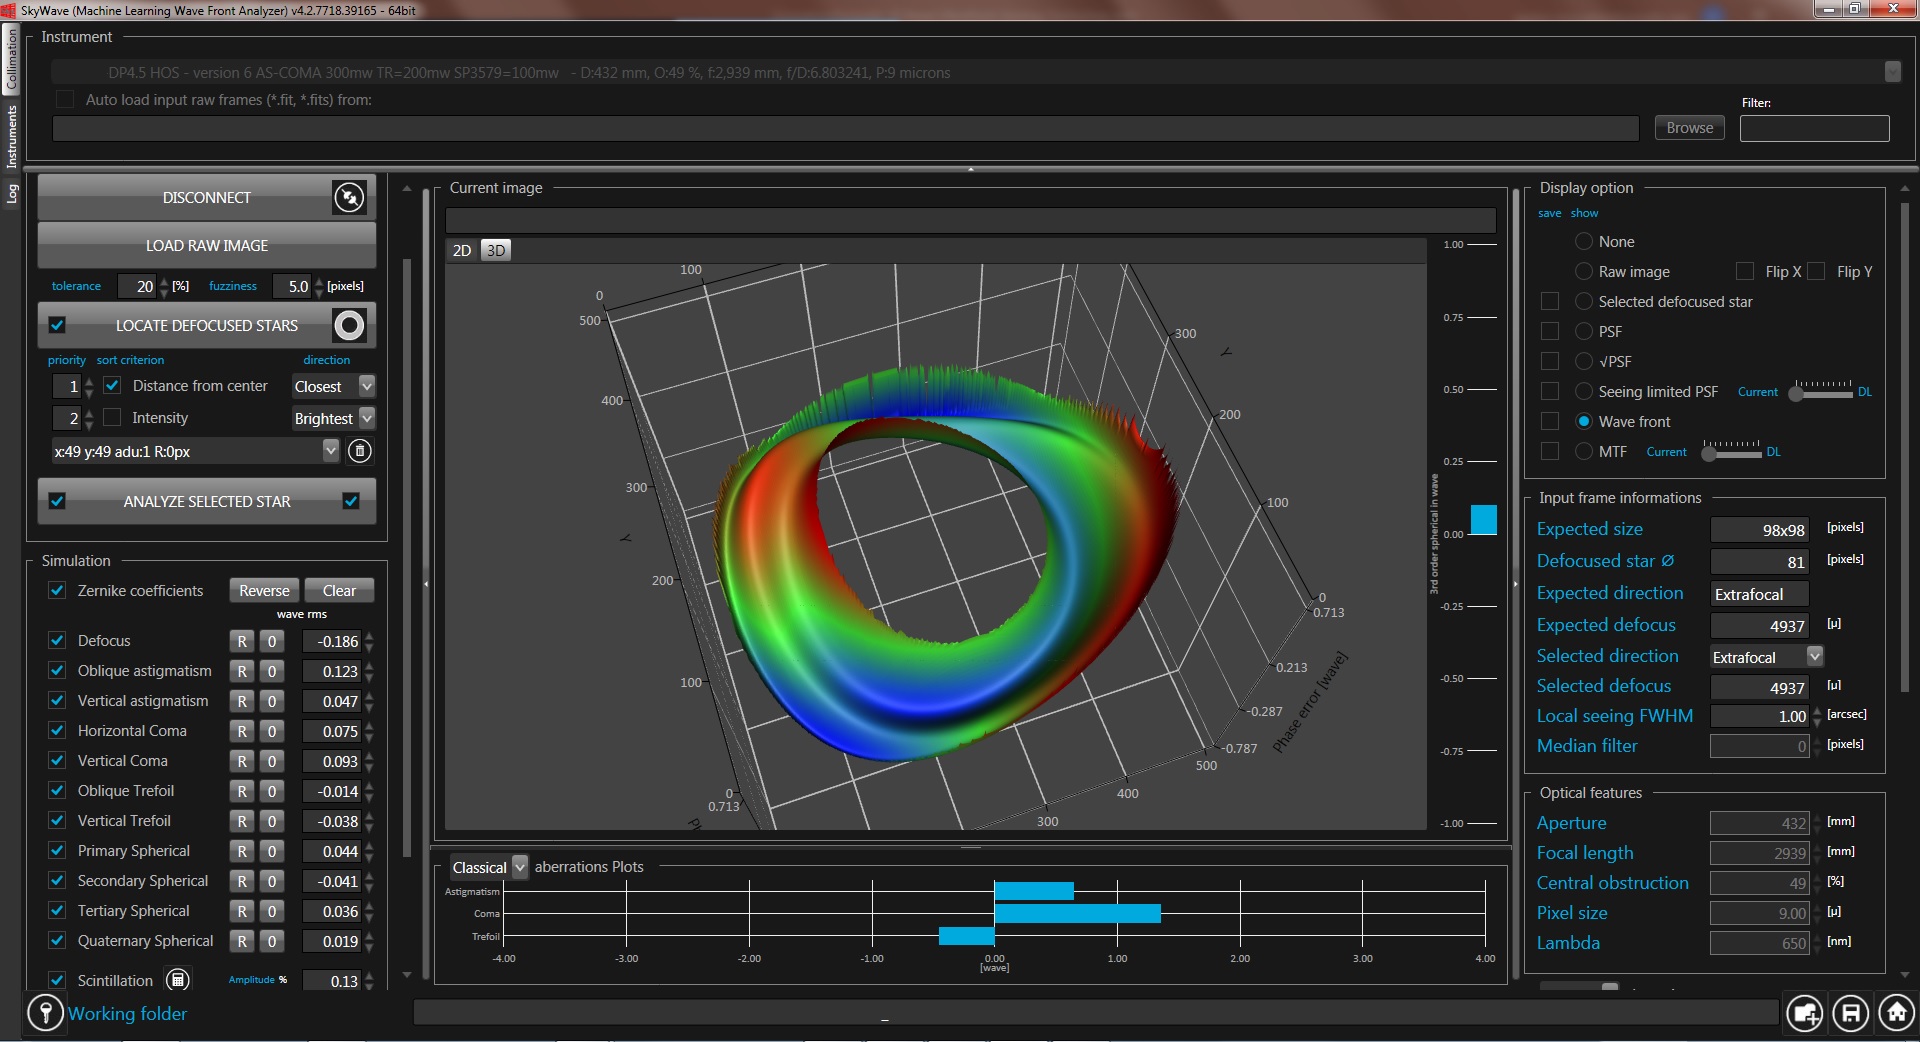
Below a screenshot of our SkyWave (SKW) Professional version software showing the 3D wavefront error of a telescope on the sky under seeing limited conditions.
SKW requires a mathematical model for each telescope, permanent models are for sale, please see our online store for further information.
SKW exists also in a Collimator version featuring a simple GUI and an user friendly collimator tool for telescope quantitative optical alignment.
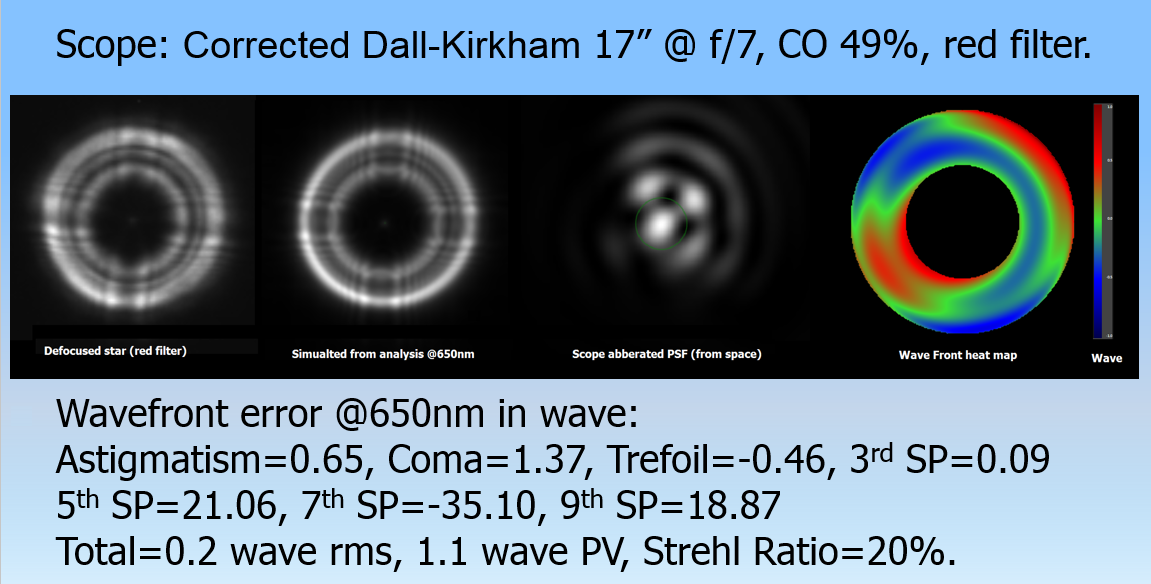
This scope is a 17″ Corrected Dall-Kirkham before proper collimation. It exhibits 0.2 wave rms (200 mw) of total WF error leading to a Strehl ratio (SR) of 20% dominated by misaligned mirror (collimation errors) induced third order coma and astigmatism aberrations. Below a summary of the analysis:
The first left defocused star image (B&W FIT file) is the raw image from the telescope taken through a red filter, the second most left image is the simulated images reconstructed using the Zernike coefficients and related polynomials outputted by the NN after adding the estimated seeing and the spider diffraction patterns. This is a monochromatic simulation, while the raw one is polychromatic will less contrast. Both images are structurally identical which tell us how good the NN analysis and retrieved WF as well as aberration are. Indeed our technology has been tested against a high-precision interferometer (PhaseCam 4D Technology model 6000) and shown a rms accuracy in the order o 10mw rms (~5nm), or better [4]. The two last images are, from left to right, the scope PSF without any seeing (in space condition) and the WF error heat plot.
While using SKW the computing time itself (stars location, extraction, pre-processing and WF analysis) is in the order of few seconds on an average laptop.
The time to load the frame from the imaging camera is of course up to the user’s imaging software used.
SKW, on request, can watch a given directory (folder) for new FIT images auto-load (this includes a filter for the file name, if any). When a new frame is available it will auto load and analysis it if it was set to do so by the user.
Alternatively the user can load a frame manually too. SKW does not connect to any hardware and therefore does not need to deal with any driver, it works only with FIT files.
Therefore SKW works with any imaging/acquisition software as long as it can output monochromatic (B&W) FIT files (8 bits, 16 bits, or float format). When using a one shot color (OSC with Bayer’s filter) camera one would convert one of the color channel, usually red to minimize seeing, in a monochromatic image. In most cases a luminance (L) frame can be used too but we recommend using a color filter to narrow the raw image bandwidth increasing its contrast when doable.
One should understand that running the trained neural network (NN) is very fast, the longest time in the process after a frame has been acquired and uploaded is to locate and preprocess the defocused star(s) in the frame as discussed above. The NN is a feed-forward one the computing time in an average laptop (Windows 7 one CPU) is less than 100ms.
On the other hand building the training databases for a class of telescope/optics (learning, validation and test data) as well as the actual training of the NN is a different story. Those tasks are done beforehand by Innovations Foresight. It may takes days to weeks to do so, depending of the size of the databases and the computing resources allocated. The NN is usually trained with at least several 100,000 to millions of samples.
However this is totally transparent for the user. When somebody buy from us a mathematical model for their scope to be run with SKW this one come in the form of an encrypted file which is decoded using your SKW local machine license key. The resulting process extracts the model data used by SKW for the related scope. The size of the model data file is in the order of few hundred MB only, and NN run time inside SKW is negligible.
It is worth noting that the SKW can analysis, depending of the software version, multi star (actual or artificial) at once, within the same frame. This approach provides field dependent (on and off axis) aberrations, like field curvature, aberrations maps (2D and 3D), and field height related wave front aberration functions (Wxxx).
This is a very powerful capability of our AIWFS technology, a single frame replaces several wave front sensors, or the need to scan the field when using a single one.
Below an example of a field curvature analysis, including the Petzval’s surface, while testing on the bench in double pass an achromatic lens using 7 artificial stars, figure extracted from the SPIE proceedings [2].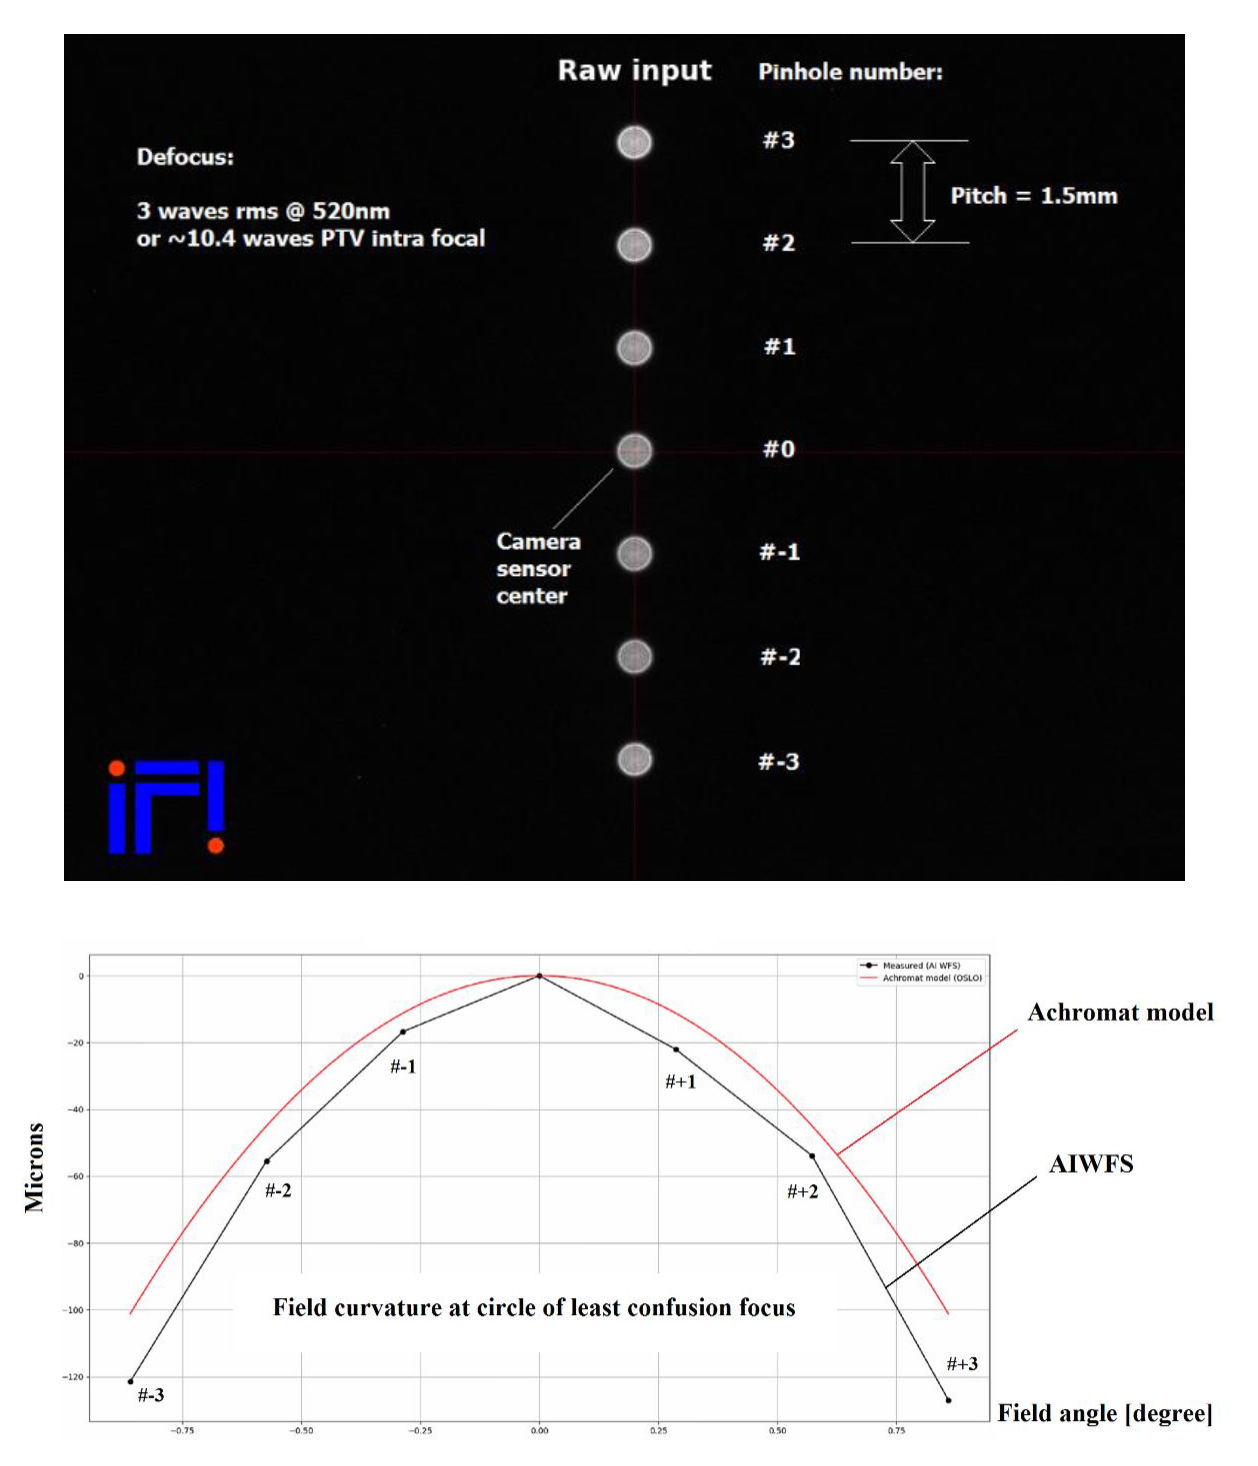 At the top of the above figure there is the raw image of the 7 defocused artificial stars (pinholes) arranged in a vertical line. The bottom 2D plot is the field curvature for this achromat along this line. In red the monochromatic @520nm achromat model curve plotted using OSLO optical design program fed with the Zemax data for this achromat, in black the AIWFS solution (7 points, pin holes numbered from -3 to +3 from bottom to top, #0 is on axis) using a green filter centered at 520nm.
The X (horizontal) axis is the field angle in degree (0 being on axis) while the Y axis is the curvature in microns. Both curves are quite close the difference can be traced back from production tolerances of such achromat and the use of a polychromatic source (green filter) for the AIWFS data acquisition. We could also make AIWFS mathematical models for polychromatic sources but this is requires more simulation time while for most practical applications the resulting difference does not justify it.
References:
[1] Roddier Claude and Roddier Francois, “Wave-front reconstruction from defocused images and the testing of ground-based optical telescopes”, Journal of Optical Society of America, vol. 10, no. 11, 2277-2287 (1993).
[2] Hickson Paul & Burley Greg, “Single-image wavefront curvature sensing”, SPIE Adaptive Optics Astronomy, vol. 2201, 549-553 (1994).
[3] Gaston Baudat, “Low cost wavefront sensing using artificial intelligence (AI) with-synthetic data”, SPIE Photonics Europe, 2020, Strasbourg, France, Proceedings Volume 11354, Optical Sensing and Detection VI; 113541G (2020) https://doi.org/10.1117/12.2564070
[4] Gaston Baudat and Dr. John B. Hayes, “A star test wavefront sensor using neural network analysis”, SPIE Optical Engineering + Applications, 2020, San-Diego CA, USA, Proceedings Volume 11490, Interferometry XX; 114900U (2020) https://doi.org/10.1117/12.2568018

