The nature of astronomical seeing
Astronomical seeing refers to the blurring of astronomical objects caused by the Earth atmospheric turbulence.
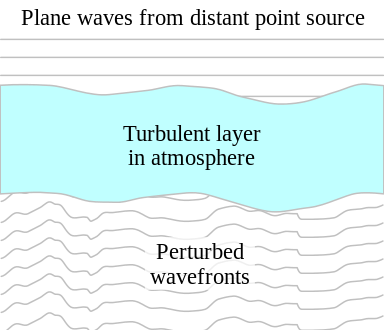
Thermal convection and winds produce turbulence cells having different optical refraction indexes, leading to perturbations and distortions of the incoming light wavefronts. It is worth noting that air motion and associated turbulence do not impact the light path itself, unless there is a change in refraction index, typically coming from temperature differences across the air mass involved in the process.
A common and popular seeing measurement is the Full Width at Half Maximum (FWHM), when related to star the FWHM is typically given in arc-second (“) and it directly relates to the Point Spread Function (PSF) of a seeing limited telescope.
The seeing impacts the quality of astronomical images in two different ways.
Short term seeing related to short exposure times (<1 second) translates to fast (<10ms) tilt/tip wavefront motions, the image of a star wanders and usually exhibits some degree of distortion (speckles).
Long term seeing (>~10 seconds) averages and smooths the seeing effect, spreading a star image, and therefore the telescope PSF, leading to a Gaussian like shape. FWHM in this situation is a specially relevant figure of merit. The FWM is related to the Gaussian standard deviation σ as follow: FWHM=2.355 σ
Seeing effect on starlight

Basic atmospheric turbulence theory
The seeing conditions from a mathematical and model stand point are described by two fundamental parameters r0 and t0 in the Kolmogorov’s turbulence theory.
It is worth to mention that both t0 and r0 parameters are a function of the wavelength of the light used for imaging, we should come back to this point later. Usually r0 and t0 are given at 550nm for the visible range.
t0 is known as the coherence time and it is equals to the time interval over which the rms wavefront error due to the turbulence is 1 radian, or lambda/(2*pi), roughly lambda/6. In short this is the time over which the image of a star can be considered frozen (constant tilt/tip values, other higher order aberrations may still exist though).
t0 is typically in the order of few ms to 10s ms. It should be pointed out that the seeing is not constant across the scope field of view (FOV), since the light from two astronomical objects may travel on slightly different paths though the turbulence in the Earth’s atmosphere. If the objects are separated by a “large” angle, one object’s wavefront distortion will not be applicable to the other wavefront, because their turbulence induced errors will be different (no correlation anymore). The angle for which the wavefront errors are almost the same is known as the isoplanatic angle, a critical parameter for AO design and operation.
Isoplanatic angles are usually much smaller, few ” across, than the imaging camera field of view for most amateur astronomers setups.
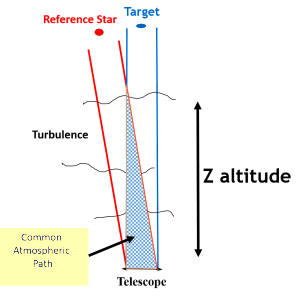
The right image shows the notion of common atmospheric path.
The final seeing effecting an image is the integral of the turbulence across the all atmosphere.
In high altitude turbulence are very different for both objects since the common atmospheric path is minimum. This can be traced to the fact that for a given angle the distance between two turbulent cells is larger, higher you are further apart they become.
Close to the ground turbulence (boundary layer) exhibit a large overlap which could cover eventually the all imaging camera FOV. However in the high altitude the overlap is minimum.
The isoplanatic angle takes in account the all atmospheric path, the integral effect.
It is usually defined as the angle, from a reference star, for which the Strehl’s ratio decreases by 2.72 (or e1) versus the reference star Strehl’s ratio.
This means that if the scope is indeed diffraction limited the Strehl’s ratio should be at, or above, 80%, 100% in a perfect situation.
At the isoplanatic angular distance from the reference star it drops down to ~37%, usually in just few arc seconds.
So the isoplanatic patch is quite small.
Commun astmospheric path

Simplified astmospheric turbulence structure

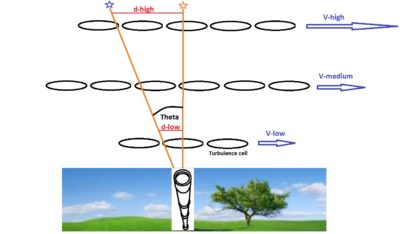
To explain better this concept of isoplanatic angle let’s have a look a the sketch on the left.
To make this simple, let’s assume that the turbulence cells have all the same size everywhere in the all atmosphere above the observer. Obviously this is not true, but it does not matter much here to understand the general idea. Inside a cell the optical properties are the same, which means the cell impacts the light traveling through it, coming from any object, the same way. Under those assumptions the wavefront seeing induced distortion for one object is valid for another one, the only condition is that all the light from both objects have traveled through that cell indeed. On the other end, two different cells impacts in a totally different way the light, this means there is no statistical correlation between them, wavefront errors for one does not apply for the other.
This is a simplified model, in reality there is a progressive, more or less smooth variation of correlation. In this sketch the atmosphere is divided in just three layers, low (near ground, or boundary layer), medium, and high altitude. Since we are talking in separation angle terms here we need to translate it in distances at different altitudes.
In the boundary layer the distance separating two object lines of sight would be d-low for an angular separation theta, in the sketch this distance is about a half of a cell size (just an example of course). For small angles (which is the case in astronomy with most amateur telescopes) we have:
d=Z*theta
Where Z is the layer altitude, and theta the angle in radian. Therefore d-low = Z-low theta. From this it should be clear that d increases with Z. If one uses 30’ for theta, or 1800”, or 0.0087 radian, and for Z-low 15m (50 feet), then d-low = 15*0.0087 = 0.13m, or 13cm, or about 5 inches. From the above sketch we could conclude that for this example the cell size is 10 inches, the size of a typical amateur scope aperture.
This means that if the seeing was only a function of the low altitude cell contributions the related isoplanatic patch would be defined by theta indeed, and the isoplanatic angle, or patch, would be around 1800”/2 = 900” or so. But there are many layers across the all atmospheric path.
For the same angle theta at high altitude, let say 20,000 feet, or 6 km, the distance d-high = 6000*0.0087 = 52m, or about 170 feet, or 2000 inches, there are now many cells involved (200)!
Which means, as far as this layer contribution is concern, the isoplanatic angle would be about 200 smaller than 900” for the boundary layer, more like 4.5”, very little! This means that higher altitude layers will create seeing effects which are not correlated inside the angle theta anymore, and now their contributions are very different across a typical 10 inches scope FOV.
Therefore the final overall isoplanatic angle must be much smaller than the boundary layer initial theta because the higher altitude contributions.
Now typically, for a given altitude (layer), the all cell structure moves at the speed of the wind V which is usually larger at higher altitudes.
This means that the coherence time (the time for a cell to move by its length) is usually much shorter for high altitude seeing contributions than from the boundary layer (near ground).
Usually half of the seeing effect comes from the boundary layer, while the other half from the troposphere/stratosphere boundary (7km to 17km).
r0 is known as Fried’s parameter, or Fried’s coherence length. It is a measure of the quality of optical transmission through the atmosphere due to random in-homogeneities in its refractive index. The Fried parameter has units of length and is typically expressed in centimeters. It is defined as the diameter (not the radius) of a circular area over which the rms wavefront error due to passage through the atmosphere is equal to 1 radian, again roughly lambda/6. Telescopes with apertures D larger than r0 will be limited by the seeing, preventing the instruments from reaching its diffraction limit.
The larger r0 the better the seeing, although r0 can reach up to 40cm in some good locations (Paranal Chili ESO), most of us are dealing with r0 values around 5cm to 10cm, with an average around 7cm. r0 is the coherence length form the all atmosphere contribution and can be seen a the average turbulence cell size.
An important figure of merit is the ratio N=D/r0, where D is the scope aperture (in cm).
For N<=1 we are essentially diffraction limited since r0>D, for N>1 we are seeing limited. In such condition you can consider that your scope resolution is given by r0 instead of D.
For D<=3, or so, the dominant seeing effect is the tilt/tip (the stars wander) of the wavefront. Larger N values involve higher order aberrations, such as defocus,astigmatism, coma, …, and speckles. Therefore most amateur telescopes are seeing limited since D is larger than their local r0 (N>1). For instance for 8” scope D=20cm three time larger than the average seeing coherence length r0=7cm (N~=3). Seeing limited scopes FWHM for long exposure time much longer than t0, which is the case for deep space imaging (DSI), is given by:
FWHMlong exposure ~ =0.025 lambda/r0 (lambda in nm and r0 in cm, FWHM in arc second (“))
For instance assuming an average seeing with a r0 = 7cm at 550nm the FWHM seeing is about 1.96”, a bad seeing with r0=5cm gives about 2.75”.
This should be compared to the typical diffraction limit of a 10” scope around 0.4”.
r0 is a function of the wavelength as the 6/5th power of lambda, or lambda(6/5).
It should be remained here that seeing, and therefore r0 for a given wavelength, is also a function of the target altitude since the atmosphere thickness increases when the above horizon altitude angle decreases.
Seeing effect on auto-guiding
Seeing is random in nature which means that seeing is made of different temporal and spatial components. There is nothing such a unique seeing time value, or a localized source (layer) for that matter.
Auto-guiding technologies, either by moving the scope or by using a tilt/tip based “adaptive optic” (AO) device, would “chase” the seeing, or at least part of it, if the guiding exposure time is not chosen with care.
Close to the ground (in the boundary layer), turbulence effects are more correlated across most of the imaging camera FOV.
The low altitude turbulence is also slower (low frequencies) and therefore auto-guiding correction rate in the range of one to few seconds may mitigate the boundary layer seeing contribution.
However for seeing effects from higher altitude layers this is not likely. Tracking faster, like with an AO, is limited by the isoplanatic patch. This means that eventually fast correction rates (1 second or less) may make things worst by spreading the guide star seeing noise across the all image FOV, excepted inside the small isoplanatic patch.
The image below shows a very good example from the Palomar AO system (R. Dekany, Caltec).
Anisoplanatism: Example from Palomar AO system

An image, inside of the Lagoon nebula, was taken with (on the right) and without (on the left) AO. FOV 40”x40”, resolution 0.04” per pixel.
It is false color image made of three IR bands, 1200nm, 1600nm, and 2200nm. This, by the way, brings us back to the point we made above concerning seeing and wavelengths, most professional AO systems are used in IR bands where seeing is much less than in the visible. One of the main reason is that in the visible range the isoplanatic angle becomes very small leading to very challenging AO systems.
The two top center cropped images zoom in the same double stars, which is also used as the guide star for the AO. On the left (AO disabled) you cannot resolve them, the FWHM is 1.2”, on the right with the AO enabled the FWHM drops down to 0.2” both stars are easily resolved. Obviously this shows the power of a “true” AO, not just a simple tilt/tip correction, or image stabilization, like those for amateur astronomers (the correction rate here is close 4000Hz).
Now let’s look carefully at the cropped star images A, B and C. They are taken with the AO enabled at increasing angular distances from the guide star (GS offset, or guide star offset). You can clearly see that the further you are the worse it becomes, and we have:
A at 5.5” => FWHM = 0.32”
B at 13.3” => FWHM = 0.45” x 0.59” (not round anymore!)
C at 23.2” => FWHM = 0.51” x 0.68” (the furthest and the worst too)
Here the isoplanatic angle is around 8” or so, not much and yet you are in the IR bands.
The AO corrections applied to the B and C locations in the FOV increase the image blur quite a lot, and introduce even distortions and aberrations (the stars are not round anymore). This is especially true if the OA system corrects higher order wavefront errors, not only the tilt/tip component, like professional ones do.
Again we should remember here that the all image is only 40″ by 40″, the AO improvement decreases quite rapidly with the angular distance from the guide star.
Comparing to the central performance the drop is significant at the C position, but of course, relative to our experience as amateur astronomers, it is still a quite good FWHM, I guess we would dream to achieve this, wouldn’t we?
Yet the star shapes are ugly, so what would be the point (beside science) to have tight elongated/distorted stars?
Anyway this example shows clearly the negative impact of fast correction rates outside the isoplanatic patch. Amateur AO device at fast rates could be relevant for double star resolution, but they should be used with caution for DSI.
Of course mount mechanical tracking errors, mirror motions, polar misalignment (beside field rotation), atmospheric refraction, and flexure are typically correlated across the FOV and therefore ideal candidates for image improvement using auto-guiding.
One option to mitigate seeing effects on tracking is to use the near infra-red light for auto-guiding. This can significantly improve the performances, up to 40%.
More detailed analysis on this matter can be found at our eduction page, guiding in near infrared (NIR).
For this matter our ONAG provides yet another unique opportunity to improve and smooth tracking while auto-guiding even under less than perfect seeing conditions.
