Wavefront analysis
The popular and traditional “star test”, looking at the Airy disk shape, is quite limited by seeing and more importantly by the type of aberration which can be revealed with such simple technique. A gross optical element misalignment result typically in on-axis coma, which skews and offsets the otherwise concentric diffraction rings surrounding a star. The “star test” is looking for such asymmetries. But as we shall see below even if the rings are eventually made concentric, this is not in any way, an indication of a good collimation, or optics.
It is a necessary, but not sufficient condition. However wavefront analysis provides a precise quantitative evaluation of the all optical system and related aberrations, even under a less than optimal seeing.
Below, first row from left to right, the point spread function (PSF) of: (1) a perfect diffraction limited scope.
Then for a 70 nm rms wave aberration (l/8) due to: (2) coma only, (3) astigmatism only, and (4) spherical only. The second row shows the Shack Hartmann wavefront modal reconstructions, color coded (red for maximum, blue for minimum phase error).
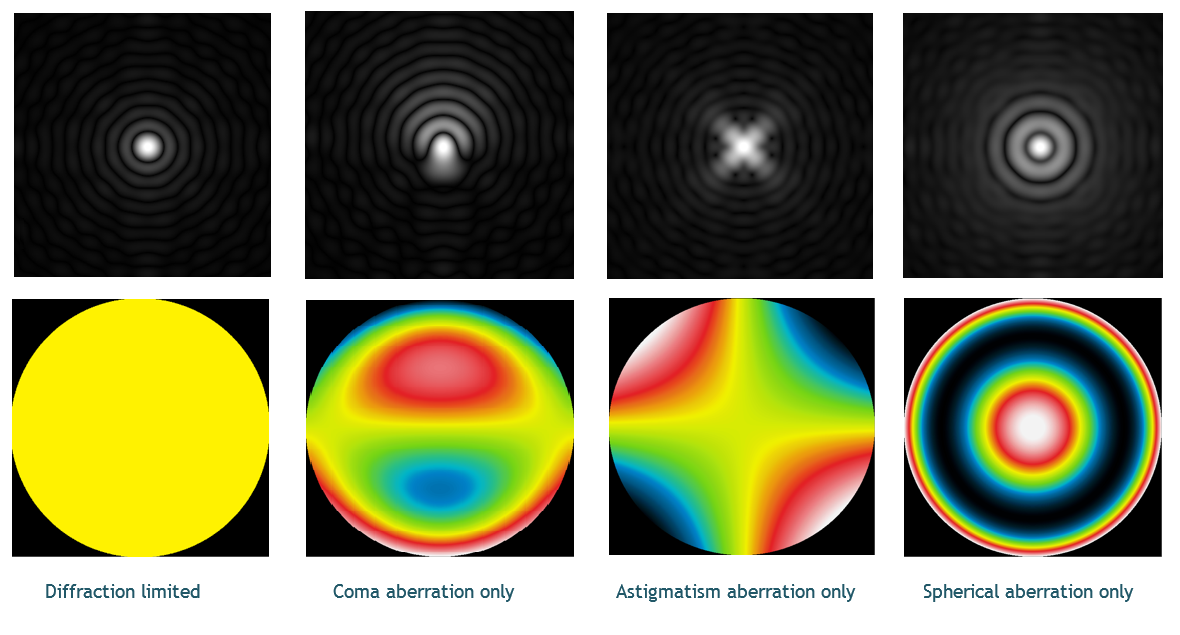
A “star test” may reveal the aberrations (2), not likely (3) and not at all (4). As a matter of fact with the later we may wrongly conclude that the telescope optics and collimation are almost perfect, when in fact the Strehl’s ratio is only 30% and the star FWHM is almost 4 times larger than it should be if the scope was diffraction limited indeed.
Therefore under such condition, for instance, a 0.5” diffraction limited scope will become 2” limited before any seeing effect!
A wavefront analyzer is essential for aberration analysis and instrumental to reach the full potential of your telescope and optical train.
Our Star Waves analyzer has been designed specifically with astronomical applications in mind.
You spent money for a great telescope, let’s us get you the performance you deserve!
Shack-Hartmann analyzer: Theory of operation
Stars are far away and can be seen as punctual sources. For many years the starlight travels without any perturbation in the space before reaching the Earth’s atmosphere.
At the top of our atmosphere the starlight wavefront is a plane wave.
Although if the last 20km takes only 66 micro-seconds, they have a significant impact on the instantaneous wavefront shape.
The atmospheric turbulence (seeing) distorts the wavefront. However this is a random process, which averages out overtime, therefore long term analyses deal essentially with plane waves too.
This is an important point, on which one shall return later on
For the time being let’s assume that the starlight is a plane wave indeed when reaching a telescope aperture. A perfectly aligned and aberration free optics should image a star as a diffraction limited pattern (Airy’s disk) at the scope focal plane.
Using a collimator, essentially a near perfect convergent lens, the star image placed at the collimator focal plane, translates to a collimated beam on the other side of the lens. Which is nothing more than a plane wave.
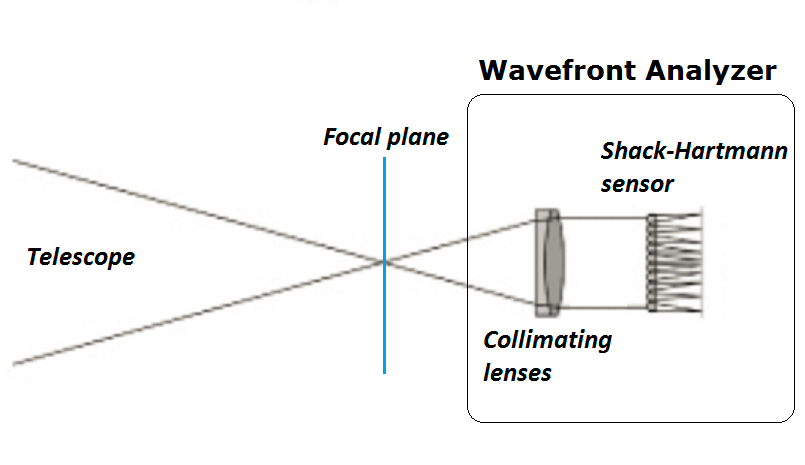
The right sketch below shows the basic layout used for an astronomical wavefront analyzer. With on the left the starlight coming coming from the telescope and converging to the scope focal plane, which is also the collimator focal plane. The reconstituted plane wave on the right side of the collimator is received by the Shack-Hartmann sensor.
Shack Hartmann sensor basic
Astronomical wavefront analyzer
The Shack-Hartmann sensor consists of a micro lens array (aka lenslet) and a CCD/CMOS sensor placed at the lenslet focal plane. Each micro-lens creates a image of the plane wave as a point (in fact a diffraction pattern). There are as many images as micro-lenses, each of them analyzes one small portion of the wavefront.
A prefect plane wave (without any tilt) means that each image is located at each micro-lens on axis focal point.
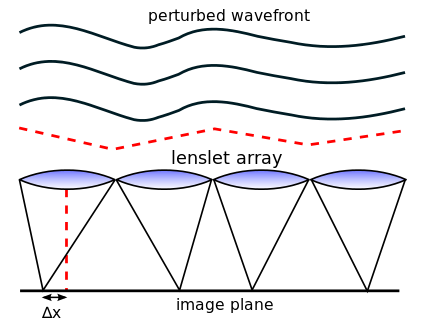
However if there is any departure from a plane wave this can be seen, from a micro-lens stand point, as a local tilt. Such tilt eventually displaced the image from on to off axis. The left figure above shows the basic principal. The X (and Y) deviation, here noted ΔX, is proportional to the wavefront tilt, or its derivative, at a given micro-lens location.
Using many hundreds, or thousands, of such tilted images advanced mathematical processing allows the precise reconstruction of the actual wavefront, which in turn provides the necessary information for retrieving the various optical aberrations, if any, involved in the wavefront deformation.
The Zernike’s polynomials are a sequence of polynomials that are orthogonal on the unit disk. They allows the analysis of the wavefront through a decomposition in elementary shapes related to different types and orders of optical aberrations. This is similar to the Fourier decomposition and analysis used in signal or image processing.
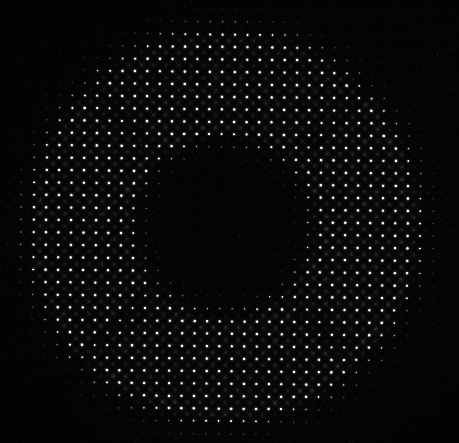
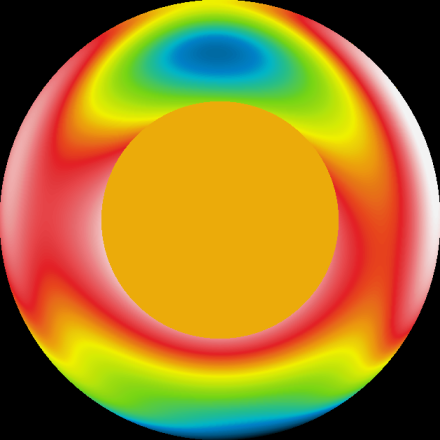
The right figure below shows the lenslet raw image array, the left figure shows the color coded wavefront from the Zernike modal reconstruction.
In red maximum and in blue minimum phase errors.
Lenslet raw image array
Wavefront modal reconstruction
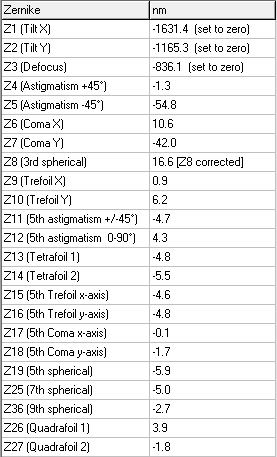
Below a plot of the 27 first Zernike’s polynomial coefficient values in nanometers (nm) for a 10″ RC scope.
On the right the associated table with the aberration names and orders.
The total rms wavefront error in this analysis is only 22.8nm
It should be noted that the Zernike’s coefficient errors must be summed according to their specific phase contributions. A simple algebraic addition is not relevant here.
The dominant aberrations are astigmatism at -45 degrees and coma in the vertical direction.
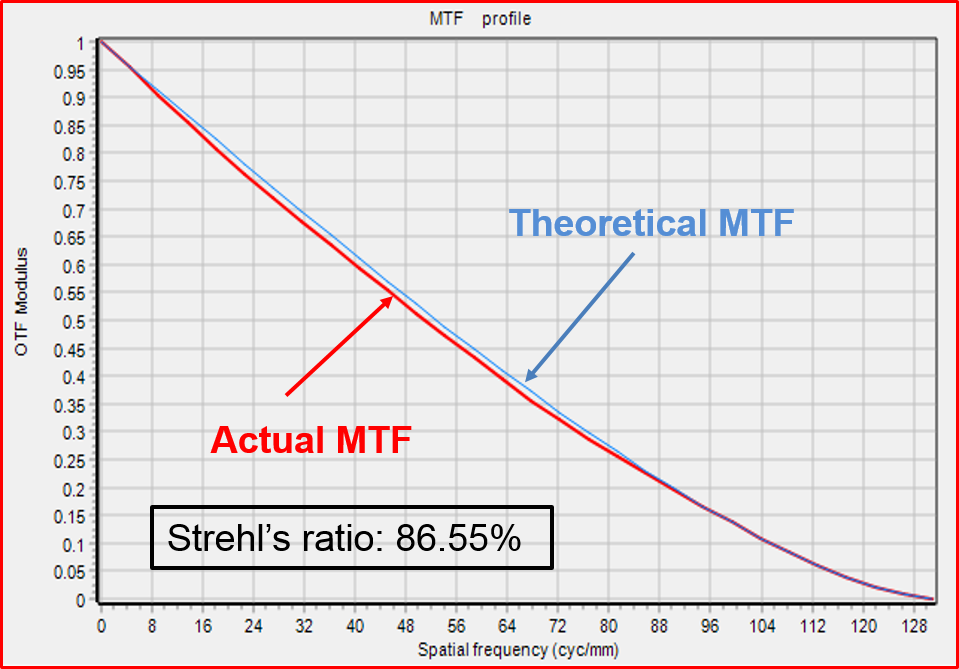
The resulting Strehl’s ratio is 86.55% which means this specific telescope is diffraction limited indeed.
Zernike's coefficient plot

Aberration table
10 inches RCT MTF after collimation
RC telescopes are challenging as far as collimation goes. Since mirror are hyperbolic not only their optical centers, but also their optical axes must be aligned. This leads to more degrees of freedom in the system.
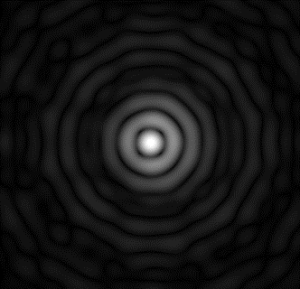
The left plot shows the 10″ RCT modulation transfer function (MTF), while the right plot shows its point spread function after collimation using a Star Waves Pro II analyzer. The results speak for themselves.
PSF
Zernike coefficents
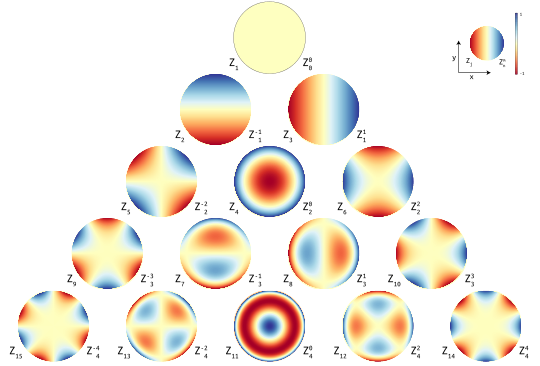
The left figure displays the color coded wavefront phase errors for the 15 first coefficients.
We can see that higher order coefficients are related to more complex wavefront shapes.
The first coefficient (1st row) is known as the “piston”, a simple phase delay, which has no effect for our applications. It would only matter in the context of coherence light source, such as a laser.
The second and third coefficients (2nd row) are the X and Y wavefront tilts.
Which usually are ignored during analysis since they are not really aberrations but tilts of the sensor plane.
The 4th, 5th, and 6th coefficients (3rd row) are astigmatisms (+/- 45 degrees) and defocus.
The other coefficients (next rows) are linked to more and more complex aberrations, such as 3rd order comas, and so on. Low order aberrations are typically, but not only, linked to optical element misalignment (known as collimation error by amateur astronomers), while higher orders are usually the results of optical surface imperfections, pinched optics, or tube currents.
Wavefront analyzer and seeing
So far we ignored the effect of the Earth atmospheric turbulence on the wavefront analysis.
As discussed above the wavefront reconstruction is based to the positions, or centroids, of the images created by the micro-lens array.
Long term exposures (many seconds, to minutes) averages out the atmospheric image wanders, proving accurate centroids.
Therefore with a long enough exposure, or a many images stacking strategy, it is possible to do an accurate wavefront analysis even under a less than good seeing condition.
This can be traced back to the fact that in the image space a long exposure, under most seeing conditions, spreads the PSF but does not change its centroid, while in the phase space the averaged wavefront shape from a star remains a plane wave.
Another way to understand this seeing immunity is to consider that each micro-lens has an aperture (around 100 microns) many time smaller than the telescope aperture. A 10″ scope has diffraction limit around 0.5″, while an one inch is about 5″. Therefore each micro-lens is diffraction limited at any seeing.
Our Star Waves wavefront analyzers can be used with natural stars, or with a optical bench and an artificial star associated with a good flat mirror in a double pass mode.
Scope F-number and Collimator set
The Star Waves Pro II wavefront analyzer requires the use a collimator optimized for a given range of F/#.
This insures that the lenslet raw image array (up to 40×40) covers a large enough surface of the sensor surface. More pixel per image leads to a better estimation of the local wavefront tilt, which eventually translate into a higher wavefront reconstruction accuracy.
In order to support a wide range of telescope we offer nine different collimators. The table below summarizes for each collimator its useful range of F-numbers.
Any of those collimator can be attached to the Star Waves Pro II, making this system very flexible and universal.
| Collimator | Minimum F-Number | Maximum F-Number |
| F/3 | F/3 | F/4 |
| F/3.5 | F/3.5 | F/5 |
| F/4.1 | F/4.1 | F/5.8 |
| F/4.7 | F/4.7 | F/6.5 |
| F/5.9 | F/5.9 | F/8 |
| F/6.9 | F/6.9 | F/10 |
| F/9.5 | F/9.5 | F/13 |
| F/11.5 | F/11.5 | F/16.5 |
| F/14 | F/14 | F/20 |


